A simple guide to creating an impact report
by Devika Thachadi Soman — Mar 3, 2023
A good impact report is not just about facts and figures. It tells you a story. A story about the impact of the organization in its area of expertise for potential partners, donors and investors. A well-designed impact report is alive with stunning visuals and catchy snippets of information that grabs the attention of the reader.
Social Impact Reporting is pretty much like communicating the strategy that conveys the change an organization has brought about in areas such as social performance, climate finance, or education impact to name a few. Typically, this is done annually to showcase not just activities that have affected change but also, an analysis of how much difference the organization has made. It helps organizations establish effective monitoring and evaluation processes for their social impact initiatives in the year. It encapsulates the impact outcomes your organization and team have made in the past year.
Here are a few tips to put together your impact report:
🎯Define the scope of your impact report: What do you want to achieve with the report, and what information do you want to include? Consider the purpose of the report and the audience you are creating it for.
🎯Come up with an attention-grabbing title: Creating a title that resonates with your target audience can help in creating an impact report that people actually want to read.
🎯Gather data: Collect data on the activities, outcomes, and impacts of your organization or project.
This may include:
Financial data
Metrics on program reach and effectiveness
Qualitative data such as stories and interviews
Testimonials from stakeholders: There’s no better way to build interest and increase the engagement of your supporters than with testimonials. They clearly and briefly express how your work has benefited their lives or those of their families or communities
🎯Analyze and interpret the data: Look for trends, patterns, and key takeaways in the data you have collected. Consider how the data supports the purpose of your report and how it can be used to tell a compelling story.
🎯Design the report: Choose an appropriate format and design for your report, considering the needs and preferences of your audience. A good report should be able to connect with your audience. It should be visually appealing and easy to read, with clear sections and headings. Your financials should be presented in a clear and concise manner. Readers don’t want to sieve through reams of data. They want statistics and figures that pop and show where donations are going and the change/impact that has been brought about. In fact, visual storytelling is the key to proving the impact your organization had throughout the year.
Examples of visuals that present financials and other data can include:
Pie charts — consider “exploded” pie or circle charts that show clearly defined amounts
Bar graphs are great for comparisons
Line graphs are awesome for showing changes over time
Icons garner better attention to the text and show representation
Quotes from beneficiaries can be showcased separately too
Highlighting key take-aways in a separate section can make certain aspects stand out
Case studies can help bring examples of organisations which have benefitted from your investments or donation and the impact they have created in the community they cater to
Images: Using eye catching images will make your report more appealing
🎯Write the report: Use the data and analysis you have gathered to tell a compelling story about the impact of your organization or project. Be sure to include clear and concise explanations of the data, and use quotes, testimonials, and other supporting material to bring the story to life. A good introduction will give a brief explanation of what to expect in the report and the reason for it.
🎯Review and revise: Once you have completed the report, review it carefully and ask for feedback from others. Make any necessary revisions to ensure that the report is accurate, well-written, and effectively communicates the impact of your work.
🎯Share the report: Once the report is complete, share it with your stakeholders and the wider public to share your impact story. This may include distributing it through social media, email, or other channels.
An effective report makes the voice of your organisation heard. It is not just about data, but the outcomes that can be inferred from that data. It is essentially the impact evidence of the organization of the year.
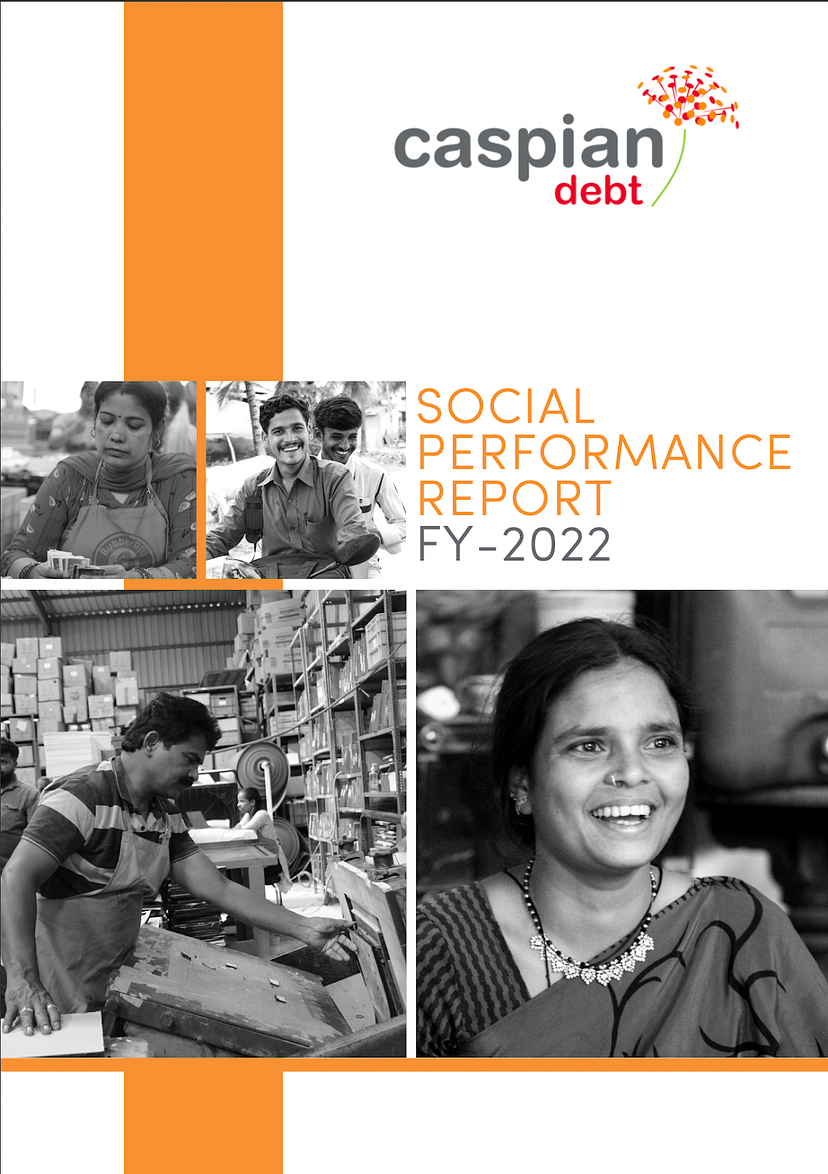
Check out some impact reports designed by our Comms Ninjas. 👇


You can view the complete reports here.
At Unlock Impact, our Comms Ninjas are adept at creating stunning Impact Reports, from design to execution. If you need assistance, reach out to us at admin@unlockimpact.com, let’s talk.


